Bitcoin price predictions: why nobody can make one reliably
People search for bitcoin price predictions hoping for a number they can rely on. Nobody can supply one reliably, and this guide explains why, how to read predictions you meet, and what a sensible reader does instead. This site publishes none of its own, and every price it shows comes from a charting tool whose data may lag.
Many forces push the price at once
Bitcoin's price is not set by one thing you can watch and predict. It moves because buyers and sellers are pushing against each other at the same moment, and each side reacts to whatever news reaches them first. A single order from a large holder can shift the balance before anyone has time to check why.
News travels fast and lands unevenly. A statement from a public figure, a rumour about a platform, or a change in how a major market treats digital assets can all pull the price in different directions within hours. The mood in other markets matters too: when investors are nervous about shares or currencies, some of that nervousness spills into bitcoin, and when they are calm, it can drain away.
New products and platform failures both move the market. A new way to buy or hold coins can bring fresh buyers; a platform that freezes withdrawals can send holders rushing to sell. Large holders moving coins between wallets is another signal traders watch closely, even when the move turns out to mean nothing.
Timing adds another layer. Bitcoin trades around the clock, so a weekend or a quiet night in Nigeria can still bring sharp moves while local banks are closed and peer-to-peer sellers are thin on the ground. Thin trading can exaggerate a price swing that would look small on a busy afternoon.
These forces interact, and some cannot be known in advance. Any model that tries to capture them all is incomplete by design.
A forecast is a guess in confident clothing
Many predictions arrive dressed up as certainty. You get an exact target, a date when it should be reached, a chart with an arrow drawn across it, and a line saying analysts expect this. The confidence is the packaging, not the evidence.
What you rarely see is the track record. A forecaster who called one big move correctly can get quoted for years, while the same person's wrong calls quietly disappear from their feed. Memory works against you here: you remember the prediction that came true because it was repeated everywhere, and you forget the many that missed.
Making a prediction often costs the forecaster nothing: there may be no deposit, no penalty and no public scoreboard. If the price goes the other way, they can delete the post, wait for a new trend, or simply start talking about something else.
Follow the incentive. A forecast of a rise may be posted by someone who gains when readers buy, whether through trading fees, a sponsored arrangement or the attention itself. That does not make the call false, but it means the person is not a neutral party giving you a reading of the market.
Treat every target and date as one person's opinion, stated with more confidence than the evidence supports. The useful question is not whether the number sounds plausible, but what the forecaster gains if you believe it.
Why past charts mislead
A chart of past prices looks like a map that was drawn in advance. Every turn seems to sit exactly where it should, and the whole path appears orderly. That clarity comes from hindsight: you already know what happened next, so the moves arrange themselves into a story.
The same shape can lead either way. A pattern that looks like a floor in one stretch of history can turn out to be a pause before a further slide in another. Two charts can look identical up to a point and then part company completely, which is why a pattern on its own proves nothing.
Stretch the view far enough and the path looks inevitable. A long chart smooths over the panics and the quiet stretches, so the climb or the fall reads as a straight line that had to happen. Zoom in and the same period is full of sharp reversals that gave no warning.
There is also the matter of which charts survive. People share the calls that worked and quietly drop the ones that failed, so the record you see is a filtered one. Indicators add to the problem because they are built from past prices, so they react after a move has begun rather than before it.
The chart tools on this site are for orientation, not prediction. The bitcoin price in US dollars is drawn from a charting widget whose figures can arrive late, so treat what you see as a rough picture of where the market has been.
How to read a prediction when you meet one
When a prediction reaches you, slow down and ask a few plain questions before you give it any weight. Most of them take seconds to answer, and the answers tell you more than the forecast itself.
- Who is saying it, and what do they gain if you believe them? A trader with a position, a channel selling access, or a broker's sponsored post each has a reason to lean one way.
- Is there a date and an exact number attached? Precision feels like expertise but is simply a guess with sharper edges.
- Are the risks mentioned at all? A forecast that only describes the upside is marketing, not analysis.
- Is there a track record you can check, including the calls that failed? If the person only shows wins, you are seeing a filtered record.
- Does it push you to move quickly or join a group? Urgency is a sales technique, and a signal group that charges for entries is a business, not a forecast.
- Is the claim about the near term? Short horizons are where confident language is least supported by evidence.
A screenshot of someone's profit proves very little. Images can be edited, selective, or taken from a lucky stretch, and you cannot verify the balance behind them. Treat a picture of gains as an advert, not as evidence of skill.
Read every prediction as one person's opinion with a motive attached. The questions above filter most of the noise before it reaches your wallet.
News, statements and the price
A headline can move the price within minutes, and by the time it reaches your phone the move has often already happened. A statement from a well-known figure, a rumour about a large holder, or a snippet of news can send traders rushing in one direction before most people have read past the first line. What you see on a chart or a peer-to-peer listing is the price after that rush, not before it.
Trading on a headline is a common mistake. The story that reaches you has usually been through several hands, trimmed for impact, and stripped of context. Ask what exactly was announced: a firm decision, a proposal, a rumour, or a comment taken out of a longer interview. Each carries different weight, and a proposal can quietly disappear.
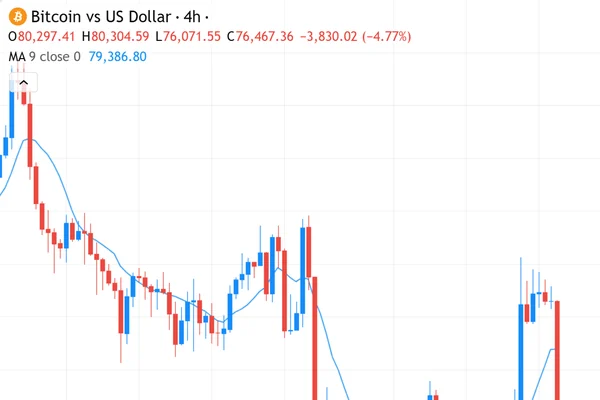
Compare the chart before and after the news. A charting tool on this site shows Bitcoin priced in US dollars, and its figures can lag the live market, so note the gap between the timestamp and the moment you are looking. If the price barely moved, the headline mattered less than its tone suggested.
News tells you what happened in a moment; it says little about where the price goes over months. Read the statement itself where you can, check who said it and in what setting, and treat the market's first reaction as a reaction, not a verdict.
Think in ranges and plan before you act
A single forecast invites a single bet: you pick a number, act on it, and wait to be proved right or wrong. A range of outcomes is more honest. Before you look at any chart, write down what a good result, a middling result and a bad result would each mean for the money you have set aside.
Decide in advance how much you could lose without it changing your month. That figure is the limit, not a target. Size any position so a bad outcome costs no more than that amount, and remember that leverage magnifies a wrong guess rather than improving it.
Borrowed money has no place in this plan. A loan turns a market move into a debt you must repay on someone else's schedule, and the pressure to recover a loss quickly is how small mistakes grow. The same applies to money you owe elsewhere: rent, school fees and business capital are already committed, so keep them out of it.
Write the plan before the chart loads, while your head is clear. Note the amount you are prepared to lose, the range of outcomes you expect, and what would tell you the plan was wrong. Looking first and planning afterwards invites you to justify whatever the price is doing.
This is general thinking, not advice, and it cannot remove the risk. Read more on handling risk sensibly before you commit anything.
Leverage turns a wrong guess into a bigger loss
Own a coin outright and a wrong guess costs you part of its value. The price drops, your holding is worth less, and you still hold the same coins. Nothing forces you to act, so you can wait, sell a portion, or simply leave it alone while you think.
A contract for difference works differently. You never own the coin; you hold a position that follows its price, funded by a small deposit that controls a much larger exposure. That borrowed exposure cuts both ways. When the price moves against you, the loss grows faster than your deposit, and the position can be closed out before you have a chance to react.
This is why a prediction becomes most dangerous when it meets leverage. A confident call that turns out wrong costs a holder some value, but it can wipe out a leveraged trader's deposit in a single sharp move. The forecast did not become better; the stakes simply grew.
Before you put money behind any prediction, check whether the product uses borrowing at all. Read the guide to crypto CFDs so you understand what you would actually be holding, and what can happen when the price goes the other way.
Why this site names no coin to buy
This site does not tell you which coin to buy, and that is deliberate. A recommendation would be a forecast in disguise, and the earlier sections explain why a reliable one cannot be made. What the site offers instead is a way to read the numbers for yourself.
Every price you see here comes from a charting tool that draws market data, and those figures can lag the live market. Nothing on the site is calculated in-house, so there is no hidden model quietly pointing you towards a coin. The bitcoin price in naira page shows Bitcoin in US dollars beside the dollar against the naira, so you can see how the two rates combine.
That second chart matters because the naira figure is not a single number handed down from above. It reflects how the dollar rate is formed, and the page explains where the official rate comes from so you can follow the arithmetic. Our method page sets out plainly what the site does and does not do: it explains, it shows data, and it stops short of telling anyone what to hold.
More guides
 Trading Bitcoin through CFDs: what it means and what it risksA contract for difference lets you follow the price of bitcoin without owning any coin. This guide explains how…
 What is Bitcoin and how does it workBitcoin is a digital currency that exists only as records on a network of computers, and no central bank or…
 How to buy Bitcoin in Nigeria: the steps and the checksBuying bitcoin in Nigeria starts with deciding where the coins will come from, because the route you pick shapes…
Read next: Trading Bitcoin through CFDs: what it means and what it risks · Coins and charts · Prices